Prometheus formatted metrics have seen widespread adoption, and CloudAMQP is keeping pace. LavinMQ comes natively with Prometheus metrics support. RabbitMQ introduced Prometheus metrics as a plugin in RabbitMQ version 3.8.0, and CloudAMQP has enabled it on all RabbitMQ servers running version 3.8.0 or higher.
Our two latest metrics integration offerings, Azure Monitor and Dynatrace, already export Prometheus metrics. It's time for our long-supported integrations to follow this path instead of relying on metrics scraped from the RabbitMQ and LavinMQ API.
Prometheus metrics integrations are available for all dedicated LavinMQ clusters and dedicated RabbitMQ clusters running version 3.10.0 or later.
How does this affect you as a user of one of the integrations?
While you can continue using the old integrations for now, we recommend switching to the new ones to access upcoming features and improvements, which will be built exclusively for the new integrations.
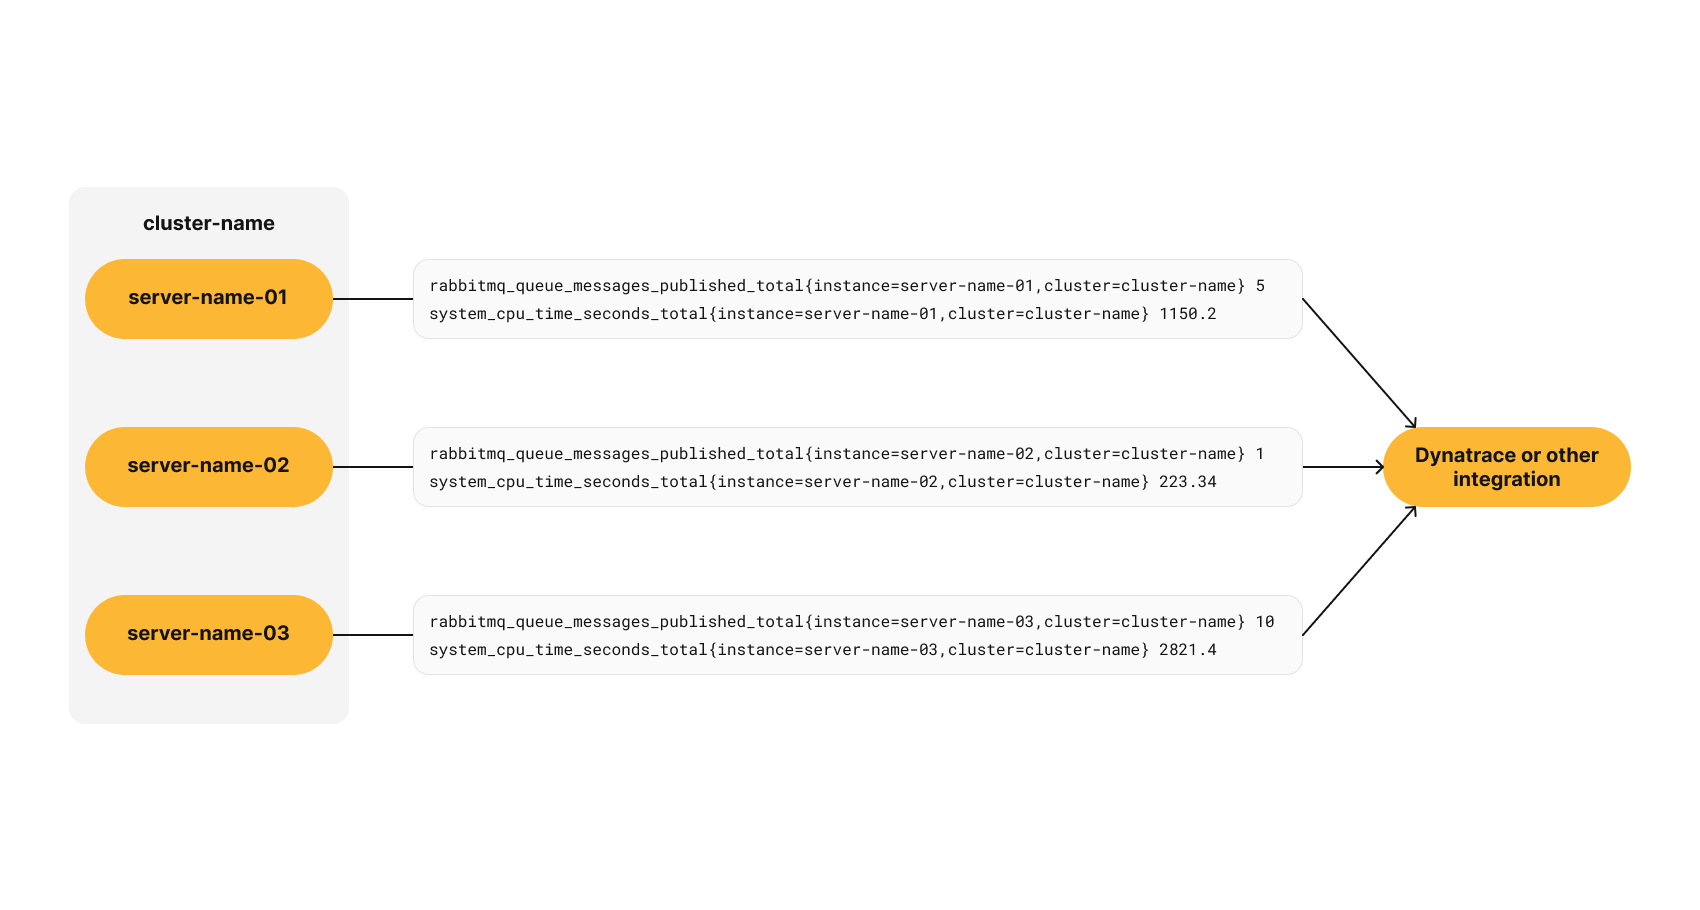
The metrics format and naming conventions have been updated to follow Prometheus standards. Metrics include the labels "instance" (containing the server name) and "cluster" (containing the cluster name). A few integrations may use different label names due to their own standards, but they contain the same values. You can always add additional labels/tags through the console and instance API. You can always add new labels/tags from the console and instance API.
Prometheus provides metrics from each node in a cluster meanwhile metrics coming from the API are aggregated across all nodes. Prometheus metrics therefore provides more fine grained metrics allowing you to either monitor the behaviors and loads on each node or allowing you to aggregate them in your Observability tool to get cluster wide metrics.
Read more
- Read more about the Azure Monitor integration
- Read more about the CloudWatch V3 integration
- Read more about the Datadog V3 integration
- Read more about the Dynatrace integration
- Read more about the New Relic V3 integration
- Read more about the Splunk V2 integration
- Read more about the Stackdriver V2 integration
If none of these integrations meets your needs, we welcome your suggestions for new ones. It’s also possible to scrape metrics yourselves, see blog post about Scraping Prometheus metrics for more details on how to do that, or if you want to know more about Prometheus metrics in RabbitMQ and LavinMQ.